Setting up Prometheus on Ubuntu 16.04
Posted at September 25, 2016
Prometheus is a great open source monitoring system by soundcloud. I personally use it on a single server to:
- Monitor the health on the server
- Monitor web traffic (nginx)
- Monitor the backend of my apps (written in nodejs)
In this post I'll install Prometheus (version 1.1.3) and Promdash (a graphical UI from the same creators).
Installing Prometheus
On your 64bit Ubuntu server:
cd ~
wget "https://github.com/prometheus/prometheus/releases/download/v1.1.3/prometheus-1.1.3.linux-amd64.tar.gz"
mkdir ~/Prometheus && cd ~/Prometheus
tar -xvzf ~/prometheus-1.1.3.linux-amd64.tar.gz
rm ~/prometheus-1.1.3.linux-amd64.tar.gz
mv prometheus-1.1.3.linux-amd64/ server
You can simply run Prometheus by running:
cd server
./prometheus
However, we need to keep the process running forever. For this I recommand using screen. Alternatively you can use nohop.
sudo apt-get install screen
screen
Use the keycombination "Ctrl-a" "c" to spawn a new screen. Start the Prometheus server:
./prometheus -storage.local.memory-chunks=10000
Note that storage flag: this prevents Prometheus from eating all your memory (set this number based on how many stuff you are monitoring how often, 10000 works great for my small server with just a few metrics).
Use the keycombination "Ctrl-a" "d" to detach the screen.
Great! Prometheus is now running, but it's not monitoring anything yet.. Let's monitor the server's health.
Monitoring the server
Prometheus retrieves data from external services via web scraping. In order to expose metrics you are interested in to Prometheus, you use exporters. You can download exporters or write your own (for your own apps). To monitor the server's health, we will use the node_exporter by the Prometheus team.
sudo apt-get install prometheus-node-exporter
Now we need to tell Prometheus that it needs to scrape the node_exporter. To do this, edit the main configuration file:
nano ~/Prometheus/server/prometheus.yml
and at the bottom of the config file, change the targets line to:
- targets: ['localhost:9090', 'localhost:9100']
which is the HTTP endpoint of the node_exporter. Finally we need to restart Prometheus, first reconnect the deattached session with screen -r. and hit "ctrl c" and start Prometheus again:
./prometheus -storage.local.memory-chunks=10000
Installing Promdash
Great! Prometheus is now watching our server, we now want a nice and slick way to inspect the metrics in some graphs in a fancy dashboard. We will use Promdash for that very purpose.
sudo apt-get install git ruby bundler libsqlite3-dev sqlite3 zlib1g-dev
cd ~/Prometheus
git clone https://github.com/prometheus/promdash.git
cd promdash
bundle install --without mysql postgresql
mkdir ~/Prometheus/databases
Promdash expects a few environments variables to be set:
echo "export DATABASE_URL=sqlite3:$HOME/Prometheus/databases/mydb.sqlite3" >> ~/.bashrc
echo "export RAILS_ENV=production" >> ~/.bashrc
. ~/.bashrc
Now we can populate the database tables and compile the frontend app:
sudo gem install rake
bundle exec rake db:migrate
bundle exec rake assets:precompile
And finally start it:
bundle exec thin start -d
Configuring Promdash
We now have Promdash running on our server, the last thing we need to do is configure the dashboard. In your browser go to `http://
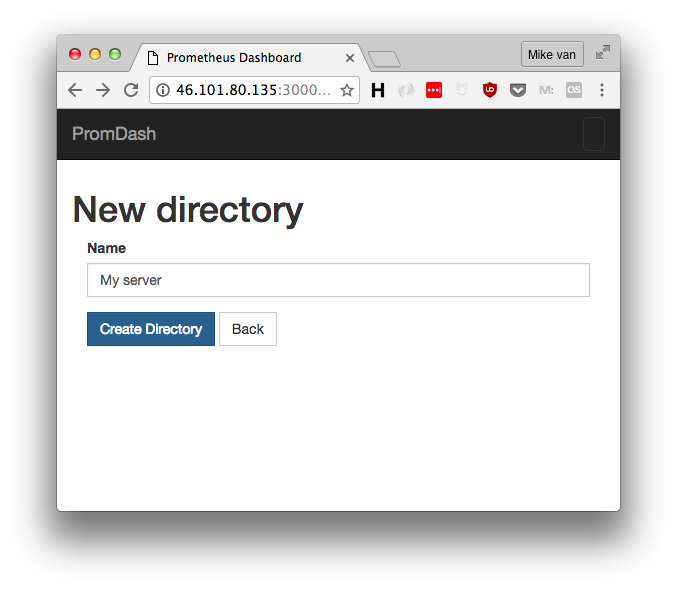
In Promdash you can create dashboards for different purposes, which you have to group in directories. So let's create our first directory:
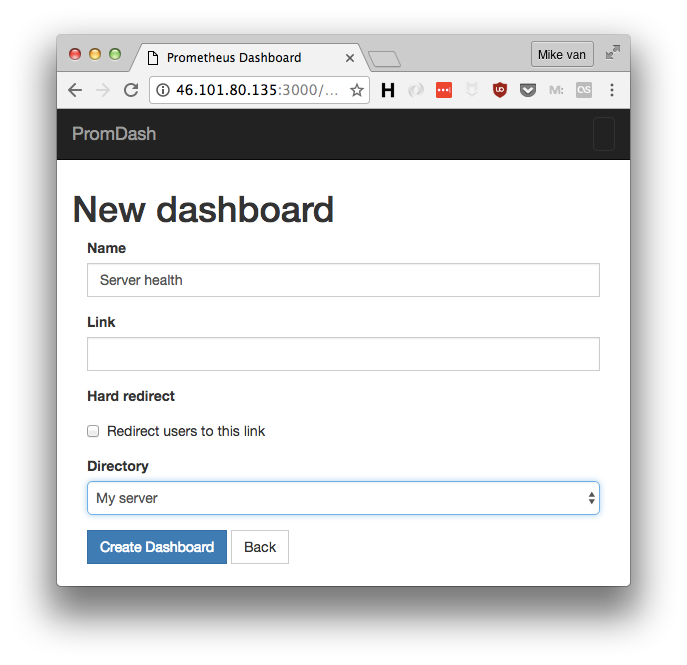
Now let's create our dashboard:
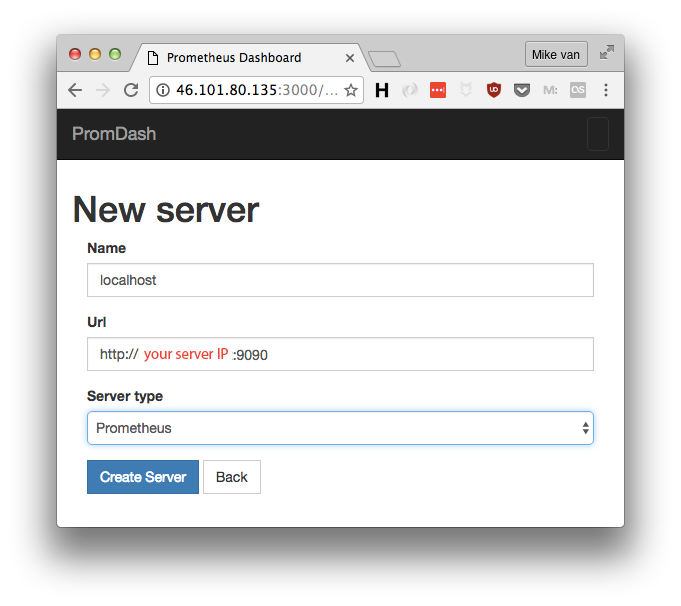
And let's create our server:
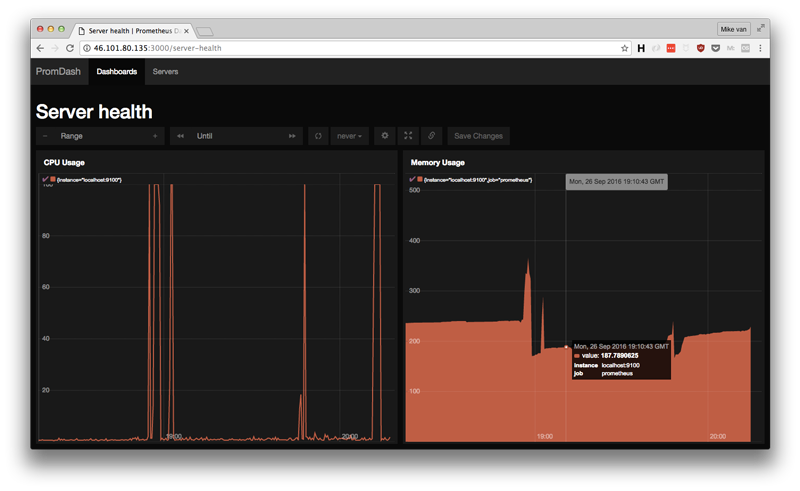
Our "Server health" dashboard will have 2 graphs, CPU usage and memory usage to start out with.
Monitor CPU usage
To monitor CPU usage hover over the empty chart and click the symbol highlighted with [1] in the image:
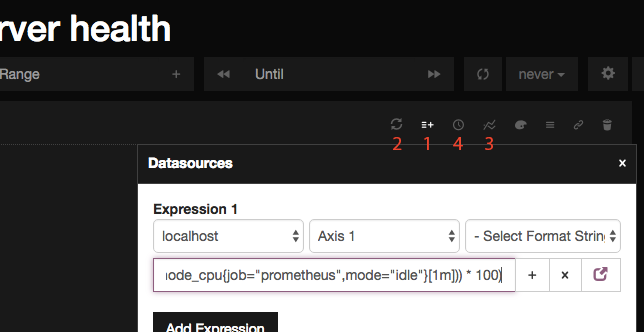
and enter the following query in the field:
100 - (avg by (instance) (irate(node_cpu{job="prometheus",mode="idle"}[1m])) * 100)
Hit the refresh button highlighted with [2] and data should pop up in the graph. To make the chart more readable let's click on button [3] and set the title to CPU usage. Then scroll down to "Y Range" and set that to 0 and 100, so that we can see our CPU usage relative to the available processing power. Finally hit button [4] and set the relative range to something like 2h (or higher).
Press the save changes button in the top right.
Monitor memory usage
Add the botom of the page there is Add Graph button. After pressing it we can use the same icons to configure this one. Under expression we fill in:
node_memory_Active / 1024 / 1024
Under "Graph and axe setting" we set the name to "Memory Usage" and the Y range from 0 to the amount of memory our server has available (for example 512 for 512mb). Under Y-Axis 1 we set the type of chart to stacked.
Press the save changes button in the top right.
And voila:
Conclusion
This was an introduction to Prometheus and Promdash, but you are nowhere near done. The next steps would be:
- Put a reverse proxy (like nginx) in front of Promdash and shield ports 9090 (Prometheus), 9100 (node_exporter) and 3000 (promdash) from outside access with a firewall.
- Add alerts
- Add more exporters
- Create more dashboards