Monitoring nodejs apps with Prometheus
Posted at September 26, 2016
Now we've set up Prometheus we can very easily start logging interesting metrics from our nodejs app.
The idea is that we will include an external node module in our app, that module will provide easy functions for the by Prometheus supported metric types. In this post we will use the metric types Counter and Gauge. The module will then expose the statistics using a lightweight express server, which Prometheus will scrape.
Logging your app
Every app might have interesting metrics. As an example we will add monitoring to my Realtime Bitcoin Globe a websocket server that relays messages about bitcoin transactions to connected webclients. Using Prometheus we can very easily get the following metrics:
- How many websocket messages is the server sending?
- How many active websocket connections does the server have?
- How many new connections did the server get?
- How much memory is the server using?
Notice that these statistics have to do with usage statistics. We could have also log metrics like: relay latency (How long does it take for transactions from receiving to sending over to the websocket clients?), transaction details (log the transactions flowing through the system) or database queries (execution times, query types, cache hits). The possibilities are endless!
Having a solid monitoring system (like Prometheus) in place will give you a better picture of what is happening in your app. This data might provide a great data resource when 1) shit hits the fan or 2) you want to measure the effect of certain optimizations (or figure out what to optimize).
The code
I'll use the NPM package prometheus-client, as it is very lightweight and does exactly what we need.
monitor.js
var Prometheus = require("prometheus-client")

client = new Prometheus();

module.exports = {
    connections: client.newCounter({
        namespace: "blocks_wizbit",
        name: "new_connections",
        help: "The number of new connections."
    }),

    messages: client.newCounter({
        namespace: "blocks_wizbit",
        name: "send_ws_messages",
        help: "The number of send websocket messages."
    }),

    connectedUsers: client.newGauge({
        namespace: "blocks_wizbit",
        name: "active_connections",
        help: "The number of active connections."
    }),

    memoryUsage: client.newGauge({
        namespace: "blocks_wizbit",
        name: "memory",
        help: "The currently used memory."
    })
}

client.listen(9095);
That last line will tell the module to setup an express server and listen on port 9095.
We can now include monitor.js in all places we want to monitor something, for example in the module that holds all websocket server logic:
const monitor = require('path/to/monitor.js');

server.on('connection', e => {
     monitor.connections.increment();

     // do other stuff
});
And to monitor the number of active users:
setInterval(() => {
  monitor.connectedUsers.set({
      period: "10sec"
  }, server.connections());
}, 10000);
Creating graphs
I've used promdash (see my last post on how to set that up), but the only thing of interest are the queries:
How many websocket messages is the server sending (per second)?
rate(blocks_wizbit_send_ws_messages[1m])
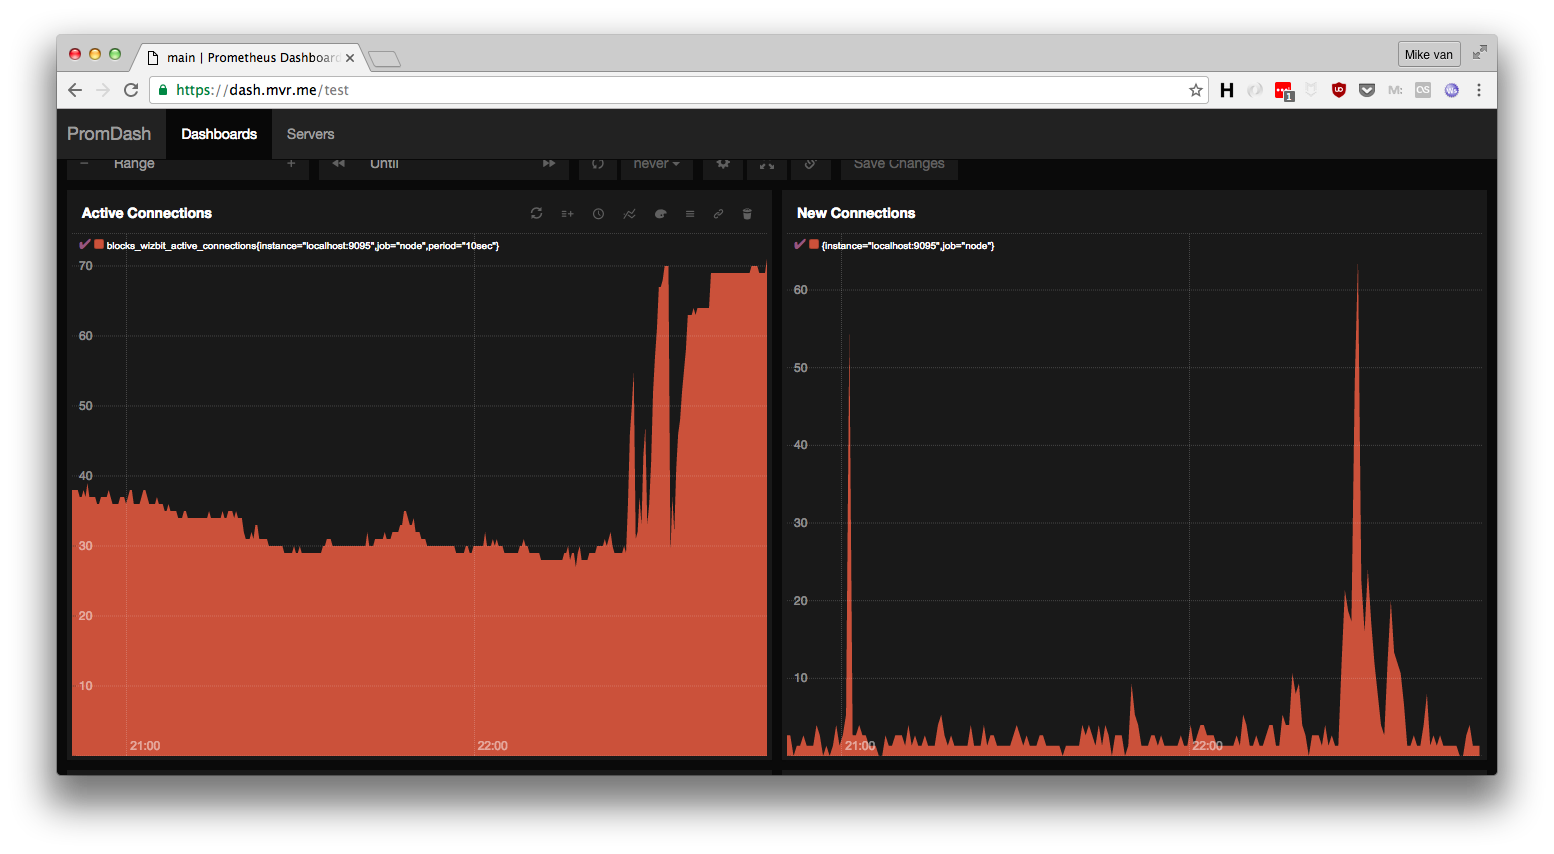
How many websocket connections are currently active?
blocks_wizbit_active_connections
How many new connections did the server get (per minute)?
rate(blocks_wizbit_new_connections[1m]) * 60
How much memory is the server using (in mb)?
blocks_wizbit_memory / 1024 / 1024
And the resulting charts will look something like this: